Salesforce Makes Agent Observability GA, Extending the Agentic SDLC
Salesforce today released Agentforce Observability into general availability. The update brings two major capabilities, Agent Analytics and Agent Optimization, directly into Agentforce Studio, with the Agent Health Monitoring capability scheduled for Spring 2026. This release signals something bigger than a feature launch: observability is becoming a required part of the agent development lifecycle, not just an optional add-on for system reliability engineering (SRE) teams.
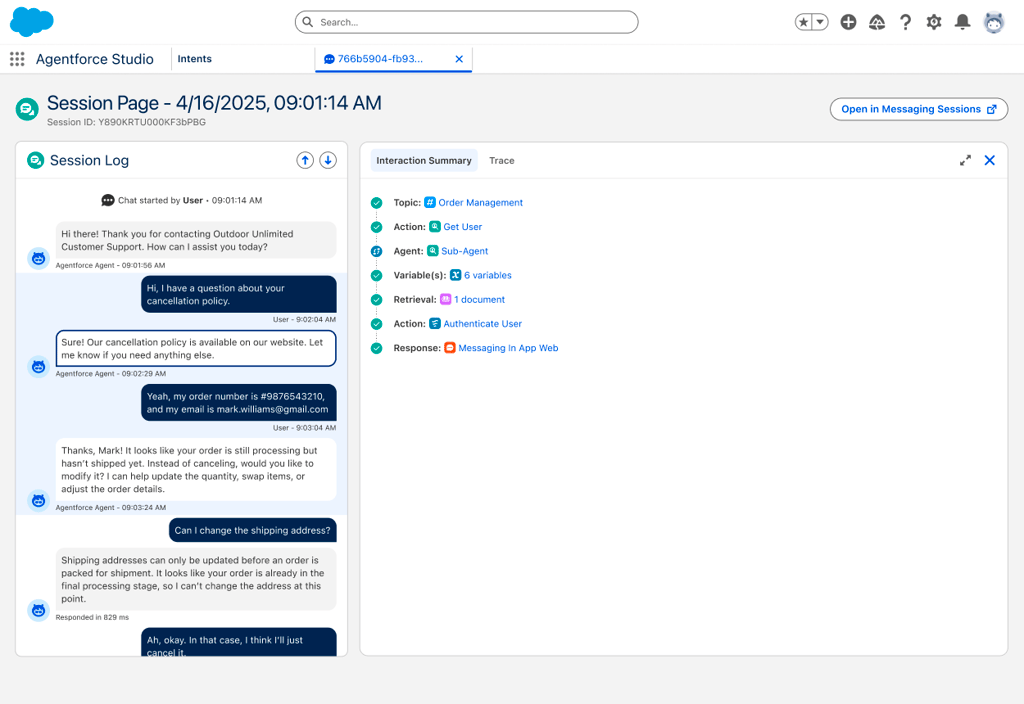
During our interview, Gary Lerhaupt, VP of Product Architecture for Agentforce, summed up the motivation: “Your agents are in a black box… now you have the capability to see the full detail, see the underlying session trace.” Salesforce wants to remove that black box and turn production data into the center of how agents are built, tested, and improved.
Table of contents
What Salesforce Actually Announced
The GA release includes Agent Analytics and Agent Optimization, with Agent Health Monitoring coming in Spring 2026. Each plays a different role inside Agentforce Studio.

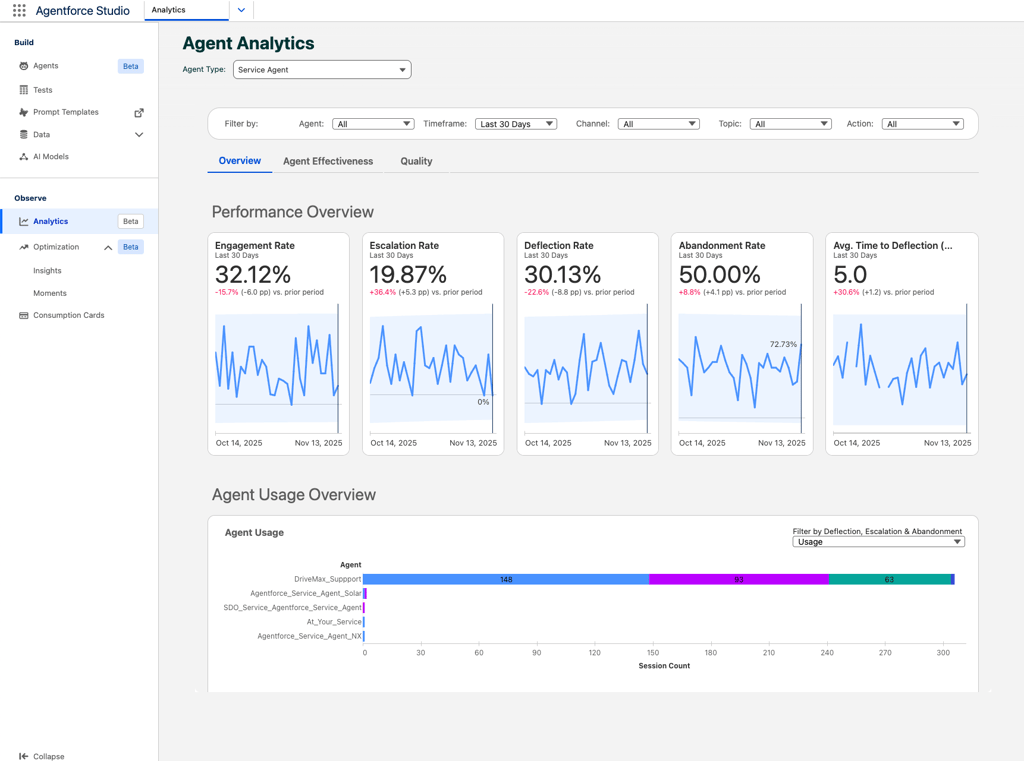
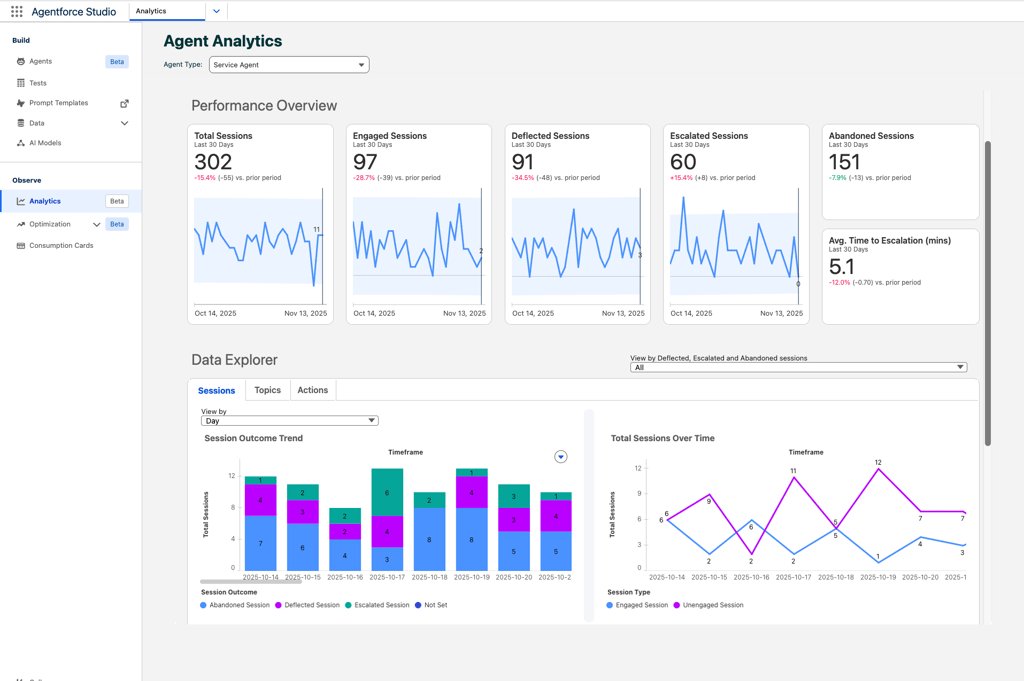
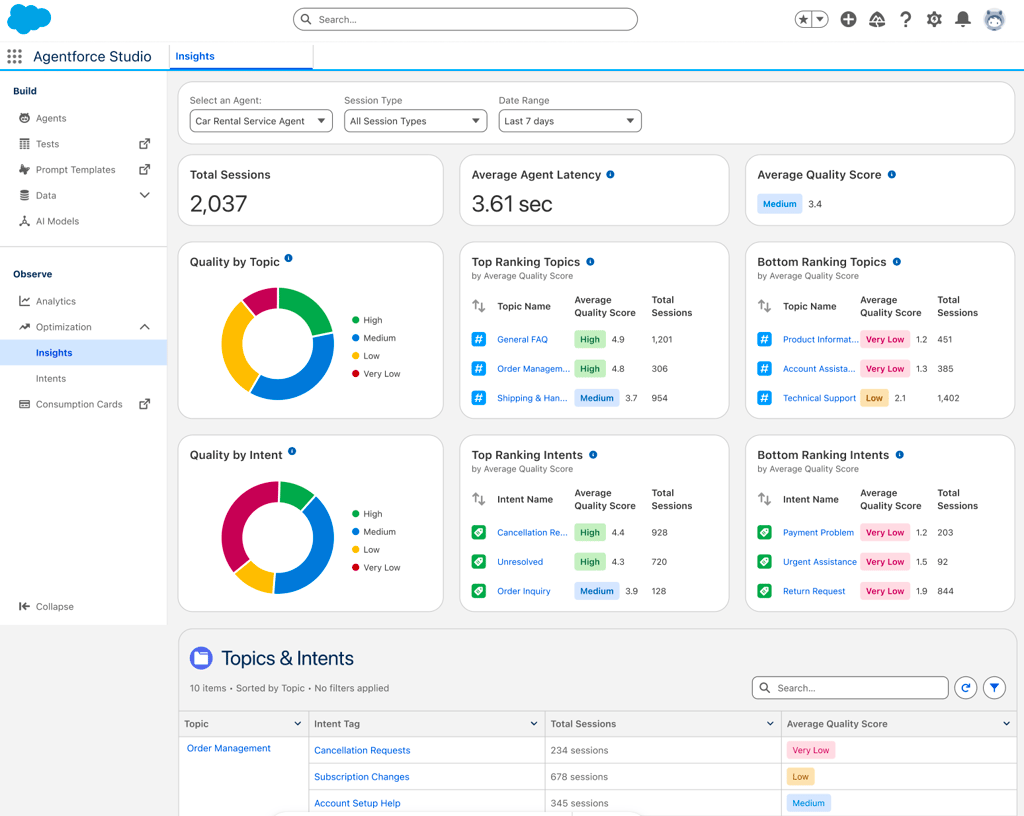
Agent Analytics: KPI Visibility for Leaders
Agent Analytics brings a Tableau-powered view of how agents perform across deflection, abandonment, escalations, volume trends, and quality scores. This is where executives can see whether an agent is helping reduce workload or generating more rework.
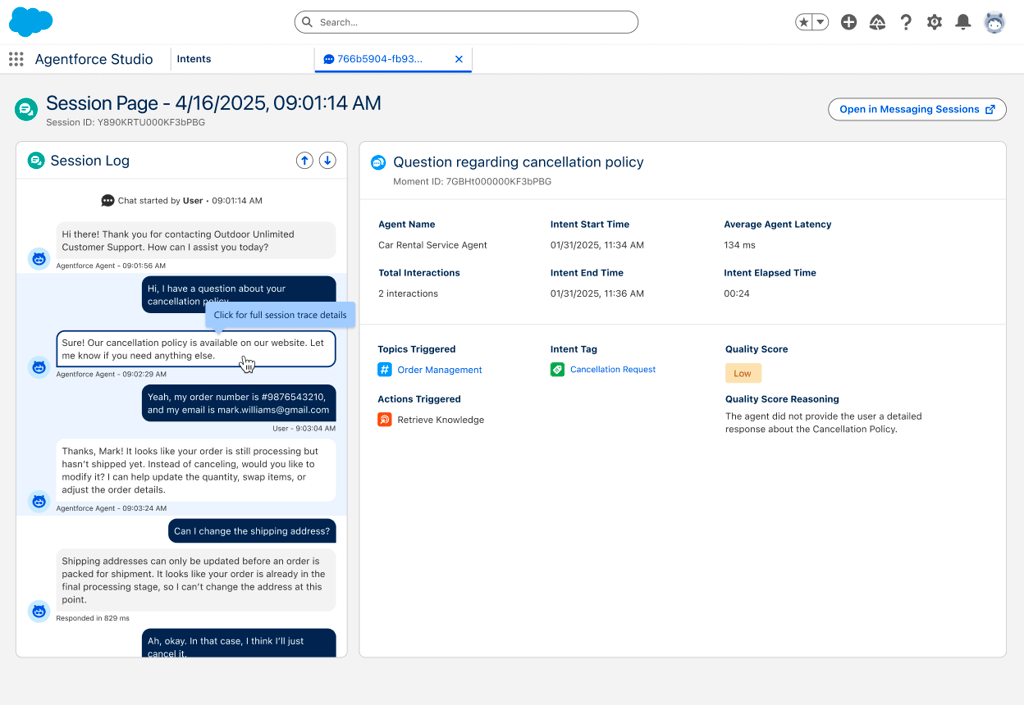
Agent Optimization: Full Session Traces and Quality Judgments
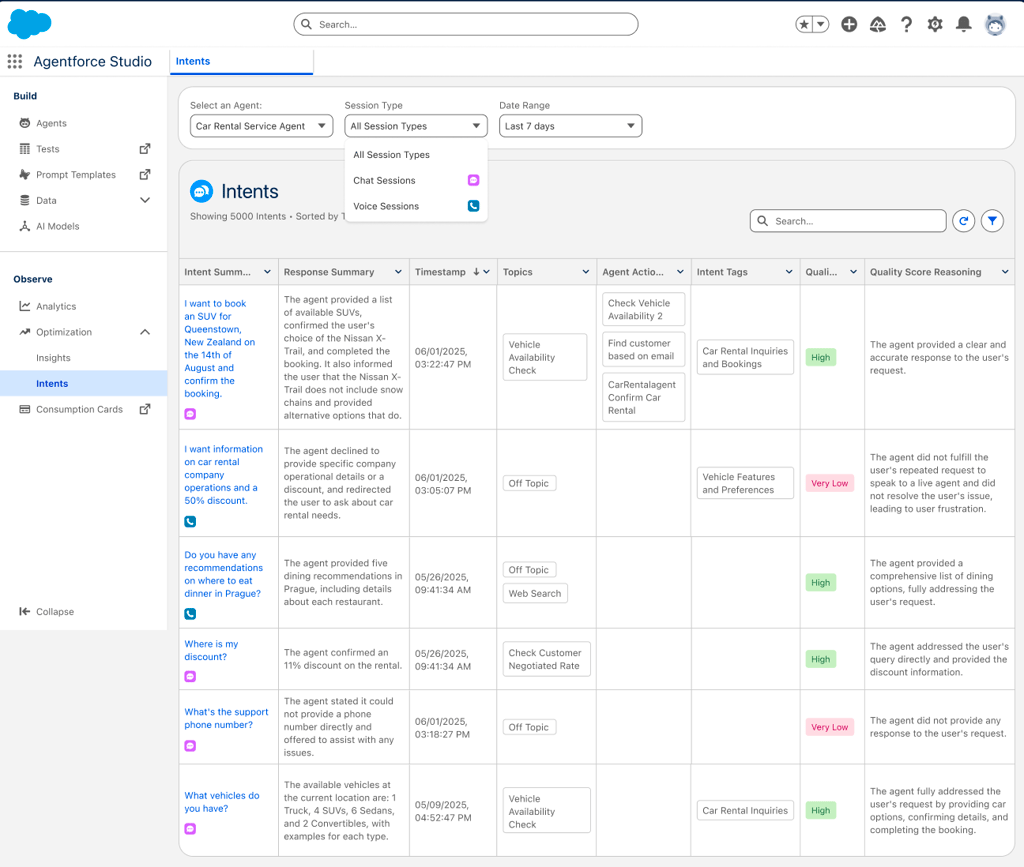
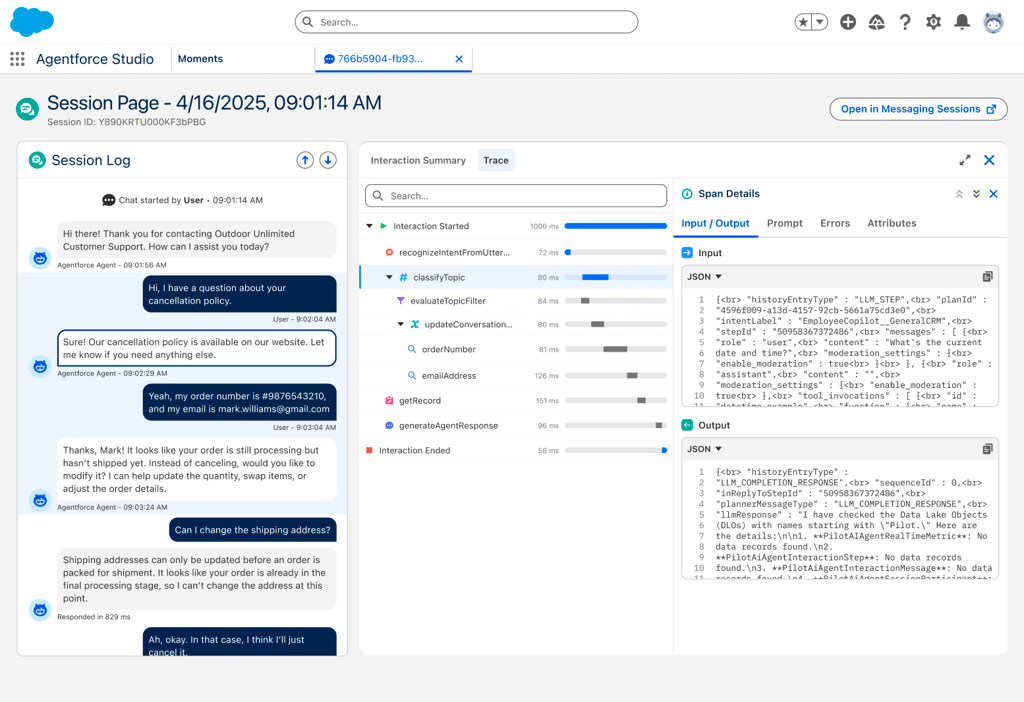
Agent Optimization is the deep view. It records every step in an agent’s reasoning chain—user utterances, LLM calls, tool invocations, guardrail checks, and response timing.
During the demo, Lerhaupt showed how the system finds “underlying intents” by clustering real production usage. He explained: “People build agents, but what actually happens in production is a whole other thing. We’ve clustered the intents for you.”
This clustering is important as Agent Optimization can also apply “LLM-as-judge” quality scoring. Each session and each intent receives a rating (high, medium, low, very low) with a short explanation. When an entire intent cluster is full of ambiguous responses or off-topic handling, the problem becomes obvious within seconds.
Agent Health Monitoring: Real-Time Alerts Coming in 2026
Health Monitoring will support uptime checks, latency tracking, error rates, and escalation spikes. Salesforce positions this as the “trust signal” layer, giving near-real-time alerts when something goes wrong. However, it won’t reach GA until Spring 2026, creating a gap for early adopters.
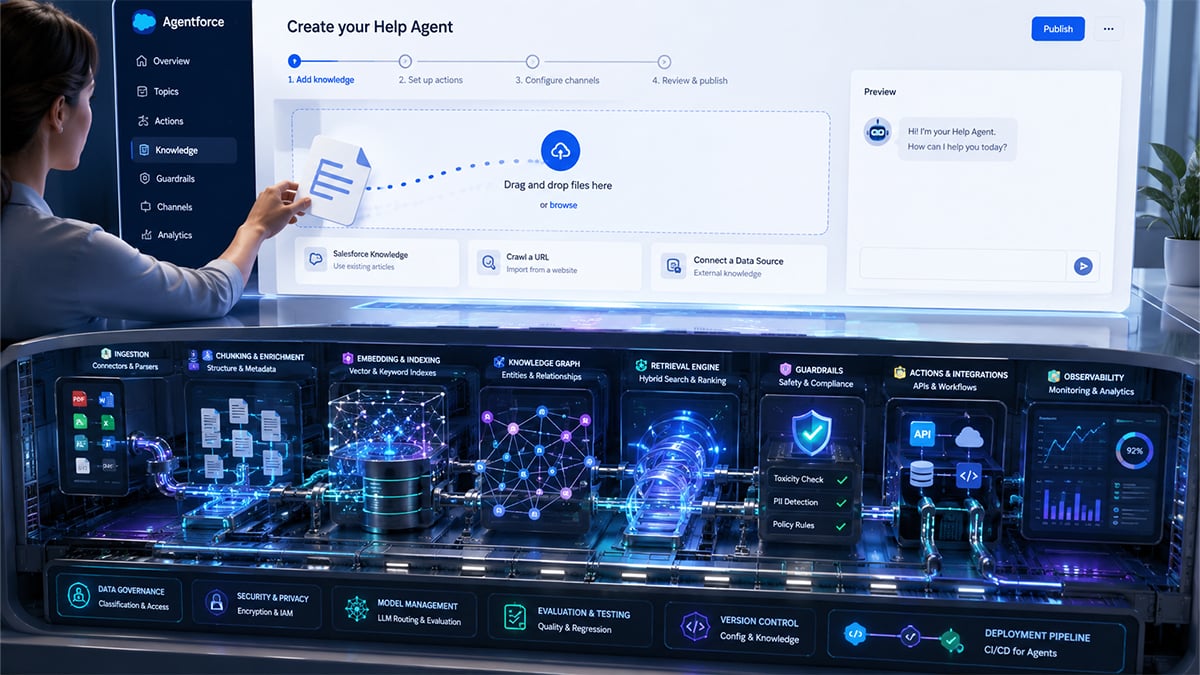
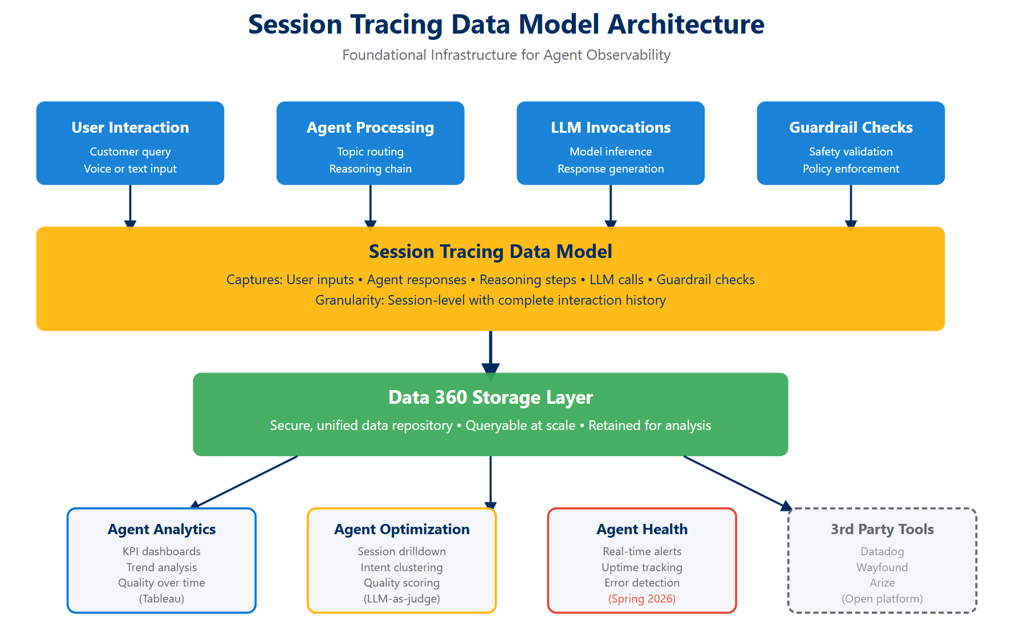
The Architecture Behind It
Two pillars support this ecosystem:
- Session Tracing Data Model (OTEL-compatible telemetry stored in Data 360)
- MuleSoft Agent Fabric (a registry and governance layer for all agents)
The important point: Observability isn’t sitting off to the side. It is built into Agentforce Studio, which Lerhaupt described as “the neighborhood of the lifecycle,” bringing build, testing, and optimization into one place.
Why Observability Is No Longer Just an SRE Practice
Traditional observability tools like Datadog, New Relic, or Splunk, were made for stable apps that mostly behaved the same way day after day. This consistency allowed SREs to use dashboards to watch latency, error rates, and uptime.
Agents behave differently. They reason in real time. They interpret language. They adapt. They fail in subtle ways long before they show hard errors. A system can reply instantly and still get the answer completely wrong.
This is why Salesforce is positioning Observability as part of a continuous “agent development loop” instead of a reliability tool. Production interactions now inform everything:
- what instructions need rewriting
- what new topics should be added
- what data sources agents should tap
- where guardrails are too tight or too loose
Lerhaupt leaned into this point during the interview, even invoking Kaizen: continuous improvement is no longer optional. It’s the workflow.
Agentforce Studio reinforces the cycle. A service lead can jump from a KPI dashboard into a low-quality cluster, then pass the insight to a builder, who can immediately update instructions or data sources. Testing happens in the same interface. A new version can ship the same afternoon.
This collapses the traditional divide between development, QA, and operations. It looks less like DevOps and more like an “agentic SDLC,” where production data drives the roadmap.
The Knowledge Opportunity: Agents as Learning Systems
Salesforce talks a lot about KPIs, latency, uptime, and error handling. Those matter. But the deeper value of Observability is the knowledge captured in every agent session.
Each interaction contains clues about how customers describe problems, how policies play out in real conversations, and what workarounds real experts use. In the past, that lived in tickets, documents, or people’s heads.
Now those traces are structured, timestamped, and tied to reasoning chains.
This is where the “knowledge flywheel” appears. If companies treat traces as strategic assets and not just logs, they can build an internal knowledge engine that compounds over time. Two companies may deploy similar agents on day one, but the one that actively mines traces for improvements will pull ahead in a matter of months.
However, Salesforce isn’t fully leaning into this yet. The platform surfaces low-quality clusters and intent patterns, but it still stops short of giving teams a built-in path to turn those insights into training data, canonical examples, or durable knowledge assets. When asked about tacit knowledge, Lerhaupt basically confirmed the gap by calling it an open opportunity.
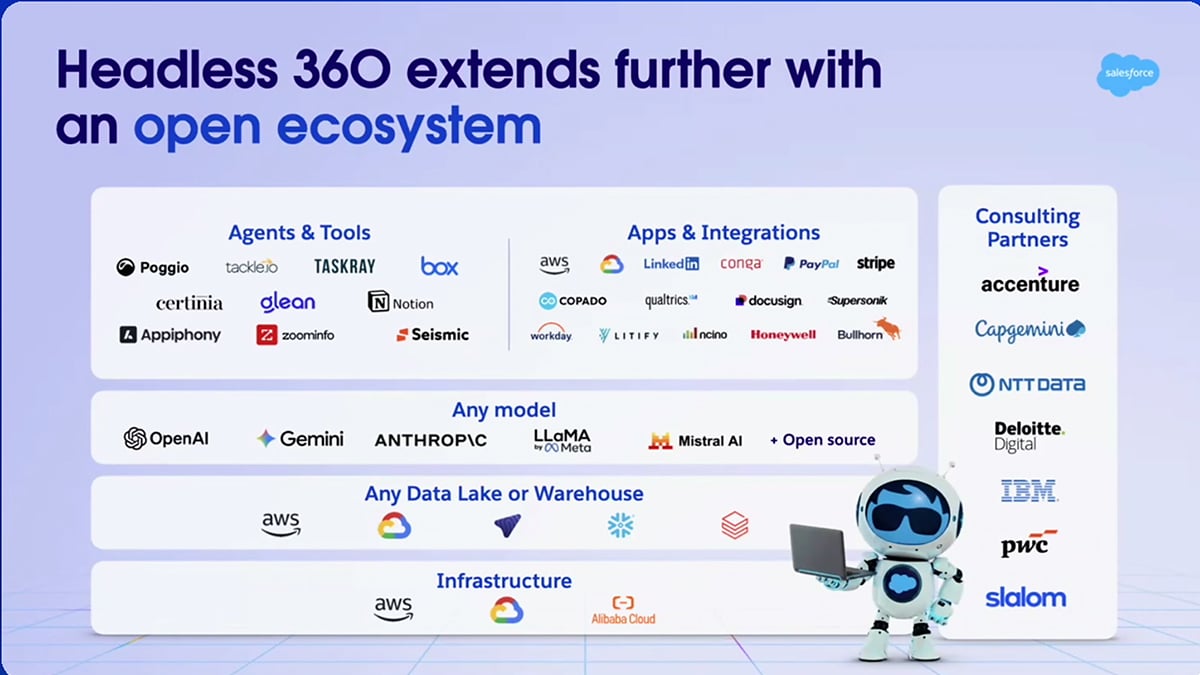
That leaves plenty of room for vendors that already operate with richer supervision layers. Tools like Arize, Humanloop, Datadog’s AI observability features, and especially Wayfound’s supervisory agents step into the gap. These systems don’t just monitor model behavior. They guide it. They evaluate interactions, flag drift, clean up messy data, and generate the curated examples that models actually learn from.
Salesforce’s OTEL-compatible session model makes this even easier because enterprises can export traces directly into these external supervisory stacks. It creates a clean path for pairing Salesforce’s native signals with third party agentic oversight and more mature dataset workflows.
If someone else builds the stronger knowledge flywheel on top of Salesforce’s data, they will control the most strategic piece of the value chain.
Interoperability, Gaps, and Operational Reality
Salesforce deserves credit for making Observability open instead of proprietary. The OTEL-compliant Session Tracing Data Model and Data 360 storage allow enterprises to send traces into their existing observability stacks. That matters because Agent Health Monitoring won’t be fully ready until 2026, and enterprises running high-stakes agents will need reliable alerting long before then.
There is also the cost reality. Full tracing consumes flex credits. Data 360 storage adds expense. External observability tools may require new licensing. But the alternative of letting autonomous agents operate without full visibility is not realistic for systems that directly interact with customers.
As Lerhaupt put it: “It’s better to do it not in the dark. Give people that spotlight.”
The Bottom Line: A Required Step, Not the Final One
Salesforce’s observability GA release is a strong foundational move. It brings agent monitoring into the core SDLC, ties it directly to Agentforce Studio, and gives developers and service teams clear insight into what their agents are actually doing.
But the strategic frontier is still open.
Salesforce has not yet solved the knowledge flywheel—how to turn millions of interactions into lasting organizational memory and stronger agent behavior. That remains the biggest opportunity in the agent ecosystem, and someone will claim it.
For now, one truth stands: deploying agents without observability is no longer acceptable. With this release, Salesforce has drawn the line, and the rest of the industry will likely follow.