Tableau Pulse Democratizes Data-Driven Decisions with AI
Tableau, the analytics company, and a division of Salesforce today announced Tableau Pulse is now generally available. The availability of Tableau Pulse marks a novel way for enterprises to leverage data where it’s needed. By using Tableau’s analytics distribution architecture, interactive automated insights through AI can be integrated across all workflows and roles. SalesforceDevops.net spoke with Tableau’s Chief Product Officer Southard Jones to understand their vision for wider analytics adoption.
“Our goal is to evolve experiences around individual employee needs—making everyone more data-informed,” explained Jones. “Composable insights allow us to reshape analytics from just being a destination into a flexible capability that meets people where they work.”
This no-code “analytics for the masses” approach aims to distribute data intelligence from sole reliance on data scientists to entire companies through reusable, personalized building blocks.
Table of contents
Automated Analysis and Generative Summarization
Pulse works by connecting to metrics from the Tableau Metrics Layer. This is a centralized data catalog enabling standard definitions and business logic to be governed across the organization. Tableau’s single source of truth ensures everyone uses trusted numbers.
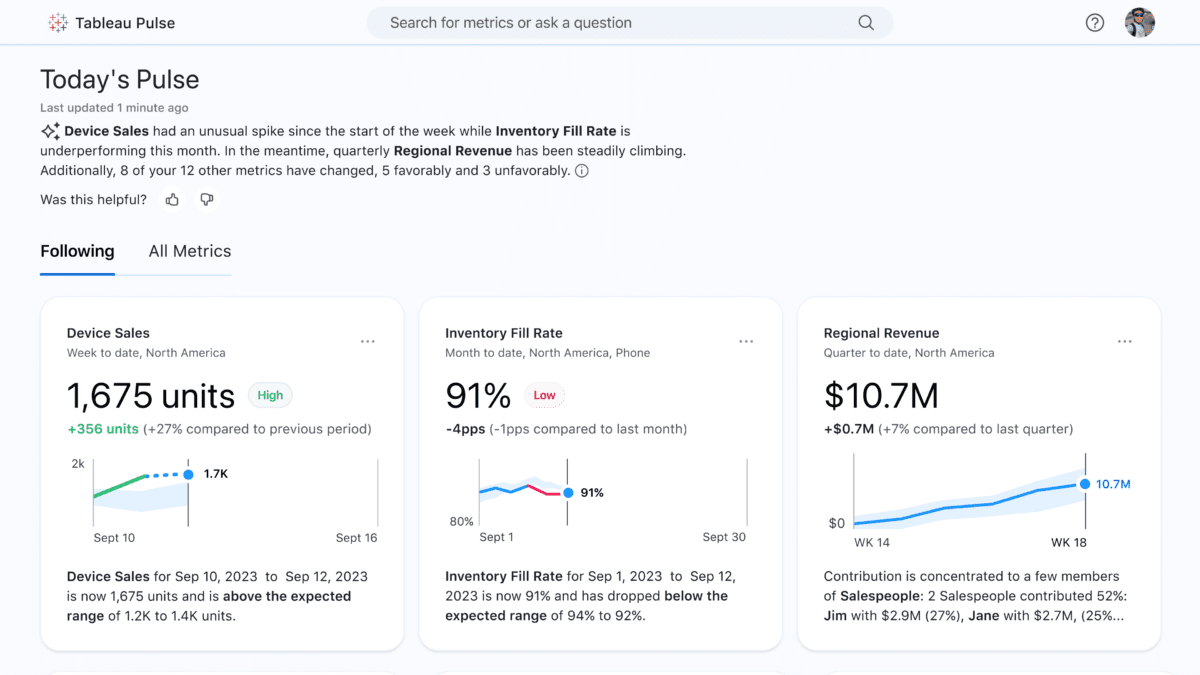
Sophisticated statistical models then run automatically on these metrics to surface drivers of changes, outliers, trends and more. The detected insights get translated from data findings into easy-to-understand natural language narratives using Tableau’s conversational AI capabilities.
For example, regional executives could receive a Pulse insight in their morning email explaining Western sales have declined 10% driven by reduced foot traffic and product availability issues. This thoughtfully narrates the data story tailored to their needs for rapid comprehension.
Seamless Embedding Enables Democratization
From an integration standpoint, Pulse uses web component frameworks like React that developers already leverage to build custom applications. With just a few lines of configuration via Tableau’s embedding API, insights can be surfaced in context of an operational app or business workflow. And this works for virtually any web-based application, including cloud native applications.
As Jones noted, “We architected Pulse entirely using frontend libraries that enterprises rely on. This allows metrics and AI-generated analysis to be consumed live wherever employees are working, creating hands-off embedding.”
By abstracting data intelligence into reusable components, Pulse makes integrating analytics dramatically more accessible. Marketing could enrich their CRM with real-time campaign KPIs without engineering resources. Mobile alerts could notify of anomalies as they emerge.
As Moritz Schieder, Visual Analytics Practice Lead EMEA at global consulting firm Deloitte explained, “Tableau Pulse allows for new interactions with data that effectively reach roles not previously engaging with analytics much.”
Schieder observed that while adapting takes time for current Tableau users, “they embraced the changes excitedly once they understood the power.” Pulse’s flexibility enabled Deloitte to quickly empower a business user needing tailored metrics without custom dashboard development.
Tableau Dogfoods Pulse for Internal DevOps
Interestingly, Tableau itself is already a power user of Pulse – particularly when it comes to tracking progress on internal projects. As Jones shared: “Our developers and DevOps teams are running Pulse to monitor their software delivery KPIs. I was just in a launch review meeting examining their Pulse metrics to assess readiness. They find it far easier than sifting through dashboards.”
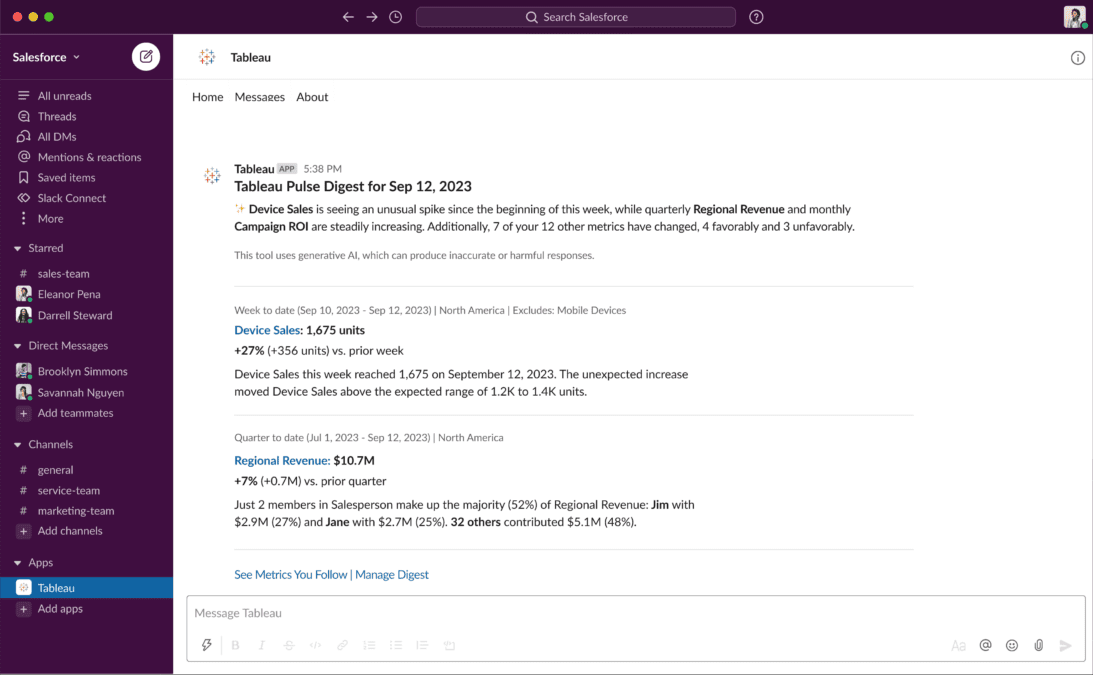
Rather than rely on crowded collections of static charts, Tableau engineers have come to embrace Pulse’s automated insights surfaced right in tools like Slack. Jones elaborated: “It used to take tons of work compiling spreadsheets that no one trusted. Pulse made it 1000x easier. The metrics now come to them with alerts on what needs attention. They told me they didn’t adopt it just because we’re dogfooding. Pulse truly works better than old approaches.”
It speaks volumes that Tableau’s own builders embraced composable analytics rather than traditional dashboarding to track mission critical initiatives. If Pulse can streamline software teams shipping cutting-edge products, it can likely unlock efficiencies in any dynamic business environment.
This real-world usage exemplifies the difference between pasted charts and actionable, accessible intelligence. As development accelerates across the board, Pulse appears poised to empower only decision makers but also creators driving digital progress.
Tableau Pulse Availability and Pricing
Tableau Pulse is now generally available and included for free across all Tableau Cloud editions, making the new automated analytics and embedding capabilities broadly accessible under existing licenses:
- Tableau Pulse Insights Platform automatically detects insights on key metrics to help users make fast, data-driven decisions.
- Tableau Pulse Embeddable Web Component allows metrics and insights to be integrated directly into custom applications with a few lines of code.
- Mobile and Slack-Based Delivery enables data digests and contextual findings to reach users on devices and platforms they already use.
For specific pricing:
- Tableau Creator is $75/user/month
- Tableau Explorer is $42/user/month
- Tableau Viewer is $15/user/month
There are no incremental fees for Tableau Pulse. It is included as part of the above Cloud license types. Embedded Analytics solutions also gain access to Pulse web components for no additional cost.
Democratization Promises and Perils
The promise of composable analytics makes enterprise intelligence modular. Metrics are now able to be broken down into reusable building blocks. Metrics, insights, visualizations become remixed and redistributed like open-source libraries. This Lego-like architectural approach enables non-technical roles to snap together the slices of data they need without coding, while developers leverage embeddable parts to enrich custom apps. Now intelligence flows freely rather than trapped in isolated dashboards.
The potential impact of this model evolves analytics from complex bespoke solutions to simple interchangeable capabilities you can assemble like blocks. But it also requires relinquishing control. Trust now relies on consistency and transparency of components’ origin, not artisan hands crafting every chart.
Regardless of its ultimate realization, the arrival of composable analytics signifies transition. No longer the specialized domain of the data team, intelligence permeates more fertile ground. But those tending the new green shoots of data must understand the foundational nutrients – what feeds the models, why they infer the way they do.